
Imagine opening an app that promises a smooth and easy experience. You’re probably excited to use it. But when you open it, you find yourself frustrated by confusing navigation. Slow load times and unclear buttons make this even worse. You struggle with it and eventually close it. You’re never going to return back to that app.
Now, flip the scenario: imagine an app so navigable and effortless that you barely think about how to use it. It just works for you! What makes the difference?
User experience, UX metrics.
Measuring UX isn’t just about aesthetics. It’s about understanding your users. In this blog, we’ll explore 15 key UX metrics that can help you track and enhance user experience effectively. This will ensure that every interaction engages users and makes them return for more!
What is User Experience?
Think about that one app you used recently that had the best performance ever. It loads quickly, and all the options are clear and spaced out. You had fun using that app because it was so easy to use. It didn’t frustrate you and left the app satisfied.
This was your user experience with that app. A good user experience keeps generating revenue for businesses. As another example, a bad user experience can cause e-commerce businesses to lose 35% of potential sales.
Businesses automatically get good clients when they aim to deliver a good UX to their users. How can you do that?
By tracking UX metrics.
What do UX metrics do?
UX metrics allow you to track how well your users are doing when they are using your app. These metrics provide insights into the overall quality of your software. Through UX tools, you can identify potential issues and make your app or website better. 49% of users have left a brand at some point due to poor SaaS UX.
We don’t want that to be your business. That’s why our blog aims to explore 15 different UX metrics.
What are the 15 key UX metrics to measure user experience?
Although there are several UX metrics, we’ve made a list of the 15 most important ones. By keeping track of these metrics, you can gain feedback.
These insights will be like the fuel to your vehicle. It has the power to raise your user conversions by 400%. But only when used correctly. You also have to make sure you’re using the right UX tools.
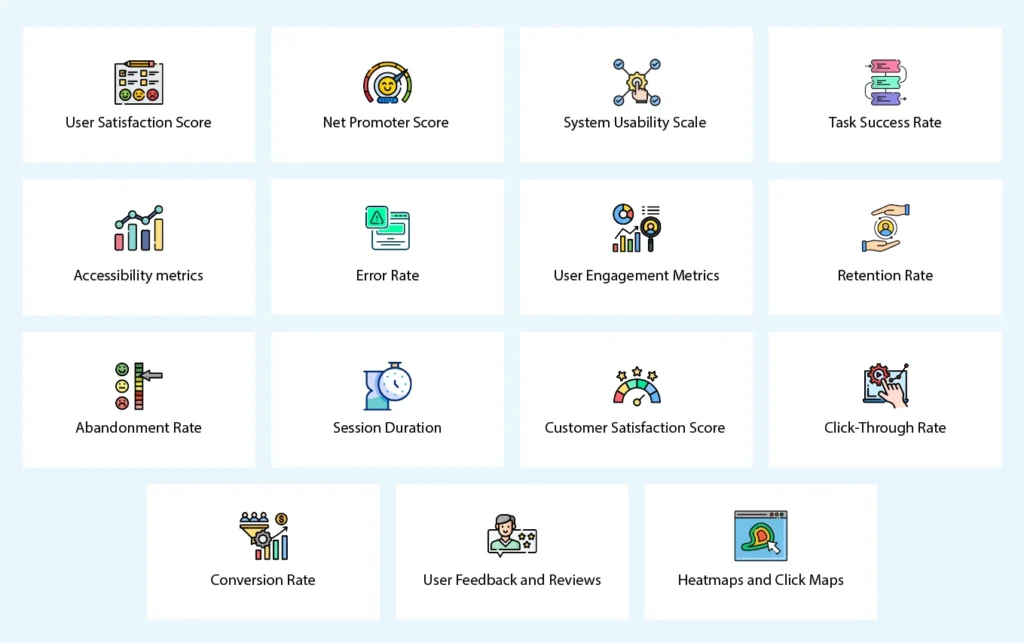
Let’s see what these UX metrics are:
1. User Satisfaction Score
User satisfaction score helps measure how much your users are satisfied with your product or software. You’ve probably seen this on apps or websites when they ask you to rate your experience.
How it works
- Users have to rate their experience on a scale. For example, 1-10 or emojis.
- All responses are considered to determine the overall satisfaction percentage.
- Higher scores mean better user satisfaction. Lower scores mean you have areas that need improvement.
2. Net Promoter Score
Have you ever found an online business so good that you told your friend right away? By doing so, you increase the net promoter score of a business. This helps companies to measure client satisfaction.
How it works
- Users have to rate how likely they are to recommend your company to others. This also works on a scale of 1-10.
- After users rate, you can distribute them to Promoters, Passives, and Detractors. This helps them calculate the overall rate.
- Promoters are those who rate 9 or above. Passives rate 7 or 8, and Detractors rate between 0 to 6.
3. System Usability Scale
Ever visited a website that asked you to answer a bunch of questions with options? This questionnaire usually consists of 10 questions and asks you about your experience with the brand. This UX metric particularly measures your experience with usability.
How it works
- Every question delivers some statements, and users have to select the one they resonate with most. This system works like a Likert Scale.
- With the help of the right UX tools, measuring system usability scale can help you quickly validate your product.
- The higher your score, the better the usability. Similarly, a mix of both high and low scores may highlight the areas for improvement.
4. Task Success Rate
Task Success Rate helps you measure the percentage of users who are able to complete a task successfully. This is also one of the key UX metrics that helps you understand your product’s usability. Good usability often brings more growth and revenue.
How it works
- You’ll have to decide on the tasks to measure your SAAS UX. You’ll also define a time frame.
- Now, you’ll monitor your users performing the task. This will help you spot usability issues.
- At the end of your results, you’ll divide the total successful tasks by the attempts. Your score determines your task success rate.
5. Accessibility metrics
These UX metrics help you calculate how accessible your software is. Complying your products with accessibility standards enables you to ensure that diverse users can access your product. The better your accessibility metrics, the happier your clients.
How it works
- Several different UX metrics affect usability. For example, the Keyboard Navigation Success Rate measures how easy it is to navigate a website without a mouse. They use only a keyboard.
- Being able to adjust the color contrast ratio ensures text is readable for users with visual impairments.
- Making content as readable as possible with the Flesch-Kincaid Reading Score helps everyone understand the content.
6. Error Rate
In UX metrics, error rate is the percentage of mistakes users make when using a website or app. It helps measure how easy or difficult a system is to use. It tracks the mistakes you make and the why behind it.
How it works
- Errors usually stem from a website’s unclear instructions. If a website is letting you submit the wrong information, it has a high error rate.
- Lower error rates mean that a website is easy to navigate and user-friendly. This is usually because these websites guide users.
- The error rate is high when users make mistakes during similar tasks. It’s low when more users complete a task successfully.
7. User Engagement Metrics
User Engagement UX metrics help you track how users interact with your website. There are several metrics that allow you to do so. Through these UX metrics, you can identify user behavior and what works.
How it works
- User engagement metrics are diverse. You have to track and calculate various rates for this.
- The feedback you gain from these UX metrics helps you gain valuable feedback. This helps you improve the user experience.
- Some examples are retention rate, abandonment rate, and session duration. We’ve explained them below.
8. Retention Rate
Retention rate allows you to measure the number of users you’re retaining in a period. These UX metrics help businesses understand well they’re doing. A high retention rate showcases client loyalty. It’s one of the user engagement metrics that gives valuable insights.
How it works
- The results from the retention rate calculation can help you identify potential areas for improvement. This will ultimately help you deliver a better user experience.
- These results will also help you improve your customer service or interface. You can try retention rates by using the right UX tools.
- If users are returning to your site after the first visit, your business is retaining customers.
9. Abandonment Rate
You’ve probably visited specific platforms where you performed a task, but you left without completing it. We’ve all been there. For businesses, however, it isn’t good. Abandonment rates help companies track when users abandon a task.
How it works
- Remember when you were at that online store but left items in your cart without buying? That’s cart abandonment; it helps businesses understand what to improve.
- Calculating the abandonment rate often helps you find a certain area where users struggle and leave.
- Lower abandonment rates mean that you have a clear interface and users are not struggling.
10. Session Duration
When we visit a new website, it takes us a little time to navigate around and find our options. When users spend a longer time interacting with your website, you’re able to calculate longer session durations.
How it works
- The average session duration is at least 2-4 minutes. If it’s lower, there’s trouble.
- Longer sessions indicate that your content is engaging. When users find things interesting, they stay for long periods.
- Lower session durations in SAAS UX help us identify areas for improvement. Such as updating content or structure.
11. Customer Satisfaction Score
This is one of the UX metrics that helps you track how much satisfaction users get from your UX. This can be for a particular page, device, product, or app. Mostly, consumers are asked to rate their satisfaction levels on a scale.
How it works
- “How satisfied are you with your recent experience?” You’ve probably seen this question after using a site. It helps measure the customer satisfaction score for businesses.
- Clients are generally asked to rate on a scale of 1-5.
- It provides valuable insights into how users perceive the usability and experience of a product. This helps identify areas to improve user satisfaction.
12. Click-Through Rate
Click-through rate helps measure how many users click on a specific link or a CTA. This measures how often users engage with clickable elements. It helps you see how effective these elements are.
How it works
- A high CTR indicates that users find the clickable elements relevant and interesting. It compels them to click.
- Lower click-through rates allow you to identify issues in the design and button placements.
- Good CTR can range between 4% to 10%. Anything that’s lower signals a low CTR.
13. Conversion Rate
The opposite of abandonment rates, conversion rates measure the number of users that complete a desired action. They do not leave it hanging. It shows how brands encourage visitors to complete actions.
How it works
- Calculating good conversion rates can help you make tweaks to your design. Good UX can help increase conversion rates by up to 400%.
- High conversion rates indicate a good UX strategy and user experience design.
- Low conversion rates indicate a need for better UX, design, and simpler UI.
14. User Feedback and Reviews
Collecting user feedback from different UX metrics can help you gain valuable insights. When customers review your business with comments, highlights, and reviews, they’re mostly honest, and you can find areas for improvement.
How it works
- You can collect user feedback in a number of ways. For example, A survey asks questions that users answer. It helps businesses gain info about themselves.
- It can either be descriptive or numerical. This is through usability tests, interviews, feedback forms, and more.
- This feedback is very valuable. You can use it to iterate the product and refine it.
15. Heatmaps and Click Maps
Heatmaps and click maps are visual representations of the user interactions on a website or app. We often use colors to highlight areas where users click the most. This allows you to understand user behavior and improve accordingly.
How it works
- Color gradients show where users interact with things most. Warmer colors indicate high activity. Cooler colors indicate low activity.
- It helps you identify the best button placements. Button locations matter in engaging users.
- It can help you discover usability issues by tracking where users click unintentionally and what’s confusing them.
UX metrics let you gather information from your target audience directly. Tracking and calculating these metrics can be a big help when you’re open to improving your User Experience.
Wrapping it up
Tracking these UX metrics can help you gain a lot of valuable feedback. When you’re creating a website or an app, your clients should be your first priority. When you prioritize them more, you’re automatically able to create user-centric designs. Regardless of your industry, users love engaging and compelling content.
At Linkitsoft, we prioritize our users. Our expertise allows us to create intuitive and navigable apps, websites, and software. No matter what you need, we’re here for you. When the development and design are good, users automatically come by. Get in touch with us to discover more about our services.
We know the struggle of finding a good software company to design and develop. This is why we’re offering high-quality, affordable services. Contact us today!


